Skip to content

Occupancy Metrics

Track workplace Occupancy Metrics effortlessly.

Image title

Occupancy metrics

Overview

Measuring occupancy metrics is crucial for businesses because of the valuable insights it offers. Such insights help optimize various aspects of a business operation, from customer experiences and marketing strategies to operational efficiencies. By accurately measuring and analyzing occupancy metrics, businesses can make data-driven decisions to improve other aspects of their business, like optimizing the physical layout and resource management. While there are existing systems such as sensors, Wi-Fi devices, and Surveillance, they all exhibit lack of accuracy, and manual intervention.

Vision AI based monitoring

Track workplace Occupancy Metrics effortlessly with Vision AI monitoring that provides real-time insights and analysis. Our ready-to-deploy model is designed to provide businesses and organizations with valuable insights such as:

  • Occupancy count: This measures the number of people or objects within a given space, such as a room or a parking lot.

  • Dwell time: This measures the amount of time that people spend in a particular location, such as a store or a workspace.

  • Traffic flow: This tracks the movement of people or objects through a space, enabling businesses to optimize their layouts for maximum efficiency.

  • Occupancy density: This measures the number of people or objects per unit of space, indicating whether a particular area is overcrowded or underutilized.

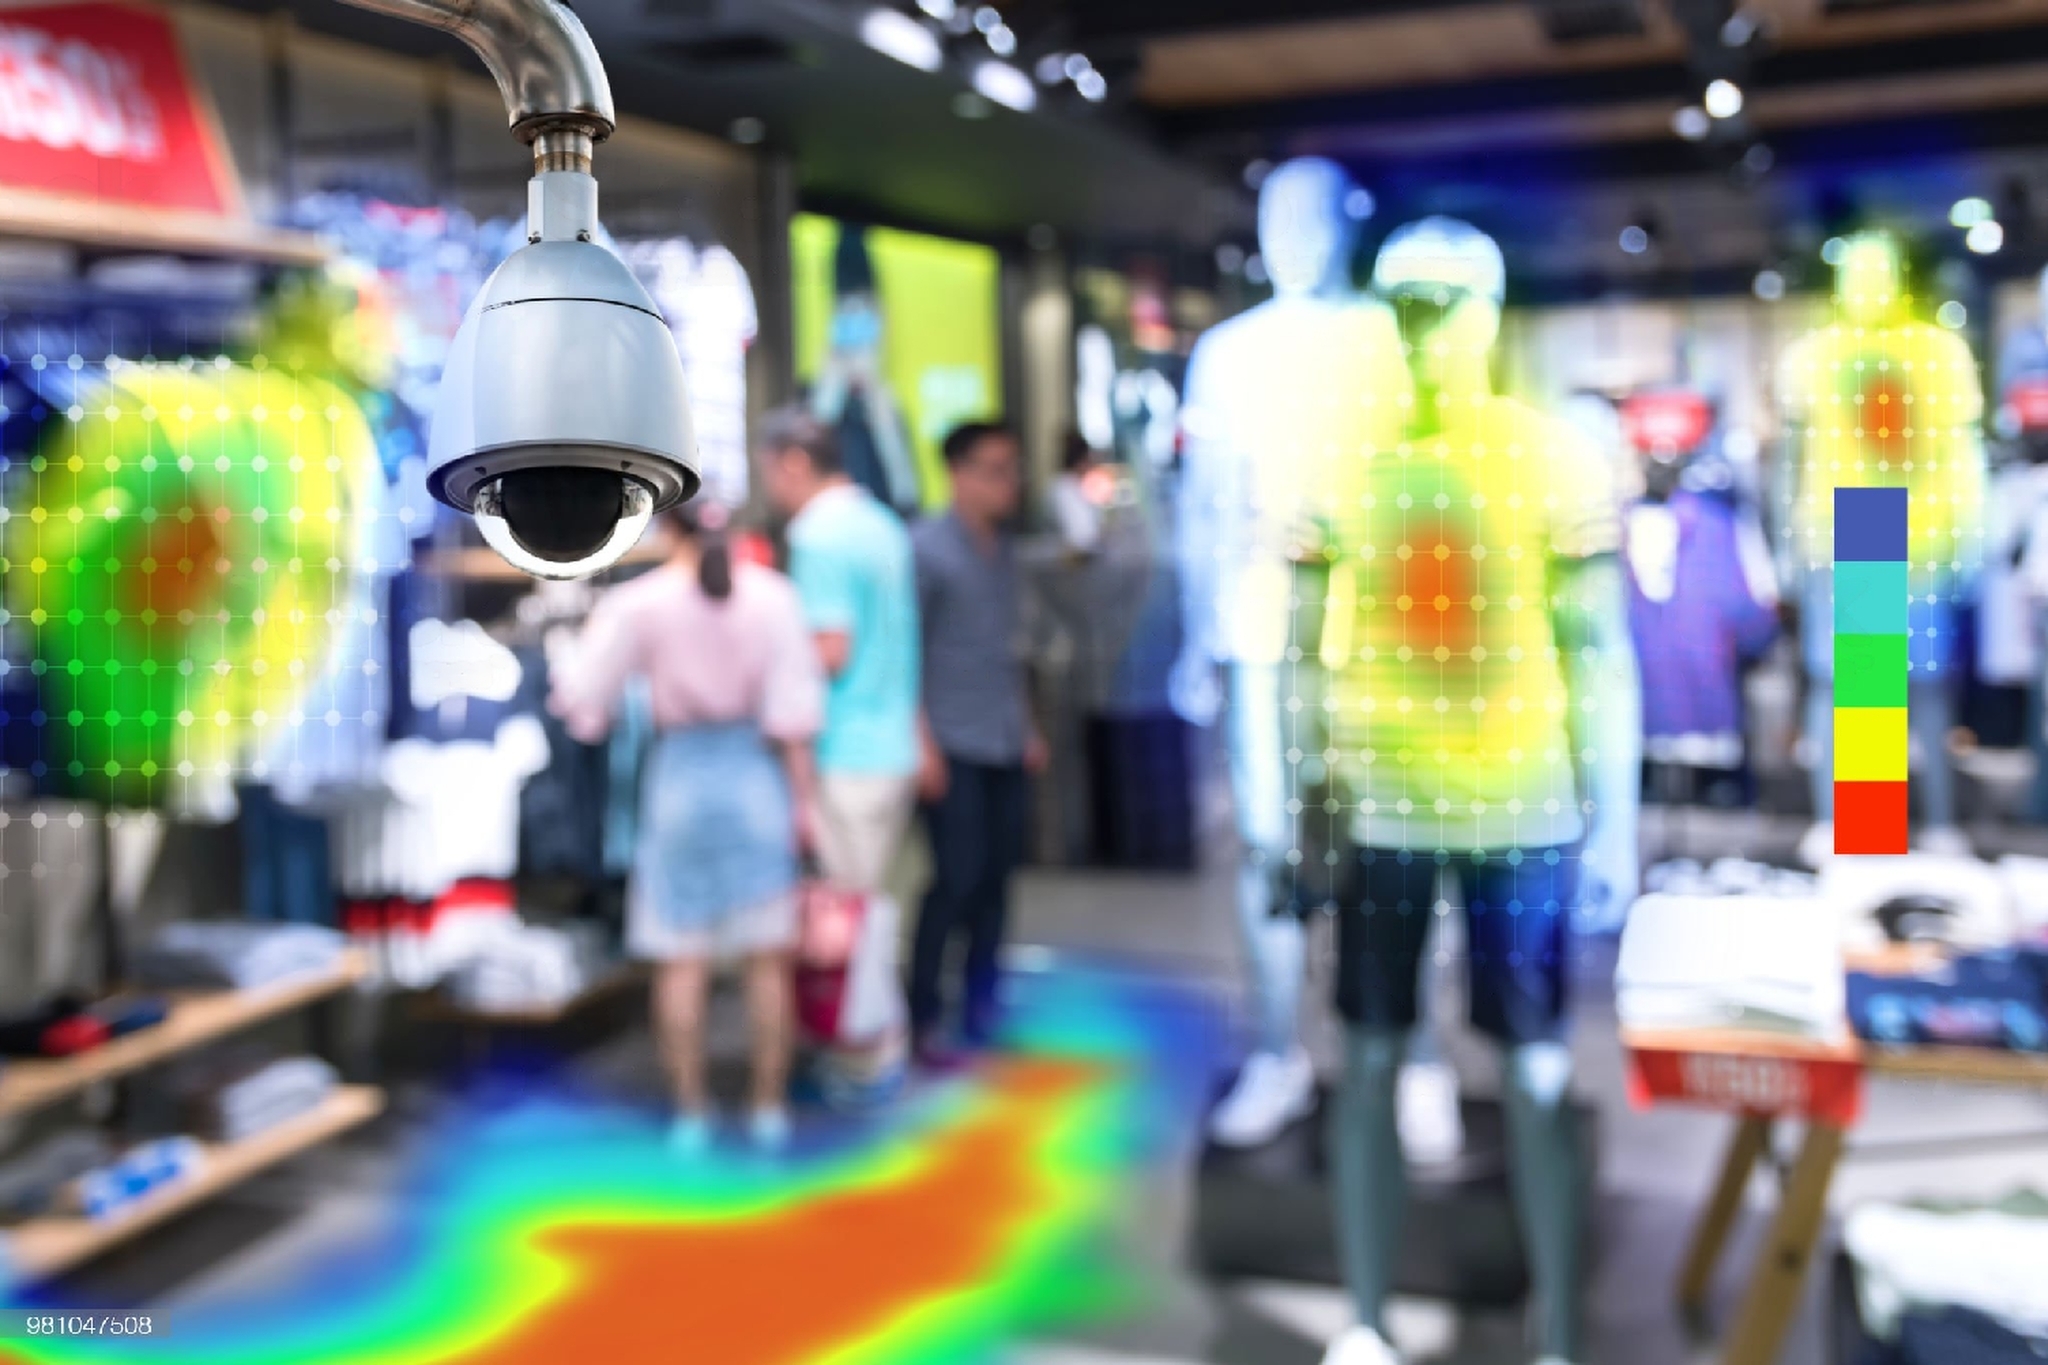
  • Heatmaps: These visualizations show the most crowded areas in a building or a room, helping businesses to optimize their layouts and improve customer flow.

  • Social distancing compliance: This monitors and enforces social distancing guidelines by identifying people who are too close to each other and triggering an alert.

  • Foot traffic: This tracks the number of people entering and exiting a building, store, or event, providing insights into customer behavior and trends.

  • Queue management: This analyzes the length of lines and identifies bottlenecks, optimizing customer flow and reducing wait times in places like retail stores and theme parks.

  • Occupancy rate: This measures the percentage of space that is occupied at a given time, providing insights into space utilization and capacity planning.

  • Crowd density: This measures the number of people per unit of space, providing insights into areas that may be overcrowded or unsafe.

  • Occupancy behavior: This tracks how people move and interact within a space, providing insights into how spaces are being used and how they can be optimized.

  • Occupancy trends: This analyzes occupancy data over time, identifying patterns and trends that can inform business decisions such as staffing, marketing, and capacity planning.

  • Occupancy alerts: This triggers alerts when occupancy levels exceed predetermined thresholds, enabling businesses to take proactive measures to manage crowds and ensure safety.

Model Details

Dataset

The dataset consists of images and videos collected from diverse sources and is designed to reflect real-world scenarios. It is evenly distributed with:

  • Images with different subjects: The dataset includes images of people or objects in a variety of positions and orientations within the space being monitored.
  • Images with different lighting conditions: The dataset includes images captured in different lighting conditions, such as bright sunlight or dim lighting.
  • Images captured at different times of the day: The dataset includes images captured at different times of day to capture the variations in occupancy patterns over time.
  • Images with different camera angles: The dataset includes images captured from different camera angles, such as top-down, side-on, or at an angle.
  • Images with different camera types: The dataset includes images captured with different camera resolutions and focal lengths to simulate real-world scenarios.
  • Images with a variety of occlusions, such as people partially hidden behind obstacles or objects.
  • Variation in subjects: The dataset includes images of people wearing different types of clothing, such as hats, coats, or backpacks.
  • Images with different camera angles: The dataset includes images that are taken from different camera angles, such as top-down, side view, or angled view.
  • Images with different environments: The dataset includes images that show different types of workspace infrastructures, environments and layout, such as standing desks, shared desks, or cubicles.

Model

The model to track events of occupancy metrics is in progress and it will be released soon.

Scenario and Potential Deployment Area Details

  • Retail stores: Retail stores can use occupancy metrics to optimize store layouts, improve customer flow, and reduce wait times.

  • Office buildings: Office buildings can use occupancy metrics to optimize workspace layouts, improve traffic flow, and identify underutilized areas.

  • Transportation hubs: Transportation hubs, such as airports and train stations, can use occupancy metrics to optimize passenger flow, reduce wait times, and improve safety.

  • Stadiums and event venues: Stadiums and event venues can use occupancy metrics to optimize seating arrangements, improve traffic flow, and enhance the overall visitor experience.

  • Healthcare facilities: Healthcare facilities can use occupancy metrics to optimize waiting areas, improve patient flow, and ensure compliance with social distancing guidelines.

  • Public spaces: Public spaces, such as parks and city centers, can use occupancy metrics to optimize traffic flow, identify overcrowding, and improve safety.

  • Manufacturing plants: Manufacturing plants can use occupancy metrics to optimize production lines, improve traffic flow, and identify bottlenecks.

  • Parking lots: Parking lots can use occupancy metrics to optimize parking arrangements, reduce wait times, and improve safety.

To test this model & scenario, you can use the following steps:

  • Install the visionai package from PyPI

    $ pip install visionai
    
  • Test the scenario from your local web-cam

    $ visionai scenario test occupancy-metrics
    
    Downloading models for scenario: occupancy-metrics
    Model: occupancy-metrics: https://workplaceos.blob.core.windows.net/models/yolov5s-occupancy-metrics/yolov5s-occupancy-metrics-0.0.1.zip
    
    
    Starting scenario: occupancy-metrics..
    
  • You should be able to see the events generated on your console window with events of occupancy metrics within the camera field of view.

[TODO]

VisionAI app is available at a Azure Market place, one can download and use it by following steps mentioned here

Features

  • Lightning Fast and Response Time: Ultra-fast Processing for real-time inference results and feedback (~30 frames per second processing) with customizable telemetry and inference results for your requirements.

  • Scalability and Instant Deployment: Our pre-trained/custom models can be deployed instantly and are camera independent which means they can be pre-installed with existing cameras on site.

  • Custom Integrations: Our custom smart dashboards and real-time alert/notification systems can be tailored to fit your specific needs be it simple dashboards or complex ERP integrations.

  • Multiple channels for notifications: Employee Role-based notifications and alerts through different omni channels like emails, messages, custom alert systems, etc.

  • Pre-Processing and Privacy by design: Our Pre-processing enhances Image quality before further analysis While maintaining data privacy by blurring out faces and other sensitive information present in a frame.

  • Intelligent Insights: Our Active Continuous Learning creates by-products in the form of intelligent insights, analytics and insightful data that helps you optimize processes and increase efficiency..

  • Hassle-free Data Access: Clients can access and manage data/insights/analytics from anywhere using Cloud services. Further, we create role-based authentication systems for access to data.

Training with custom data

The scenario is provided as part of our GPL-v3 package for VisionAI. If you wish to train this with custom datasets, please contact us and we can provide you with the training code. You can do custom training with your own datasets for free, as long as it complies with GPLv3 license (you give back the code to the community). If you are interested in a custom license, please contact us.

Contact Us

  • For technical issues, you can open a Github issue here.
  • For business inquiries, you can contact us through our website.